Free editable library · preview 0.1.0

Build the data story. Keep every piece editable.

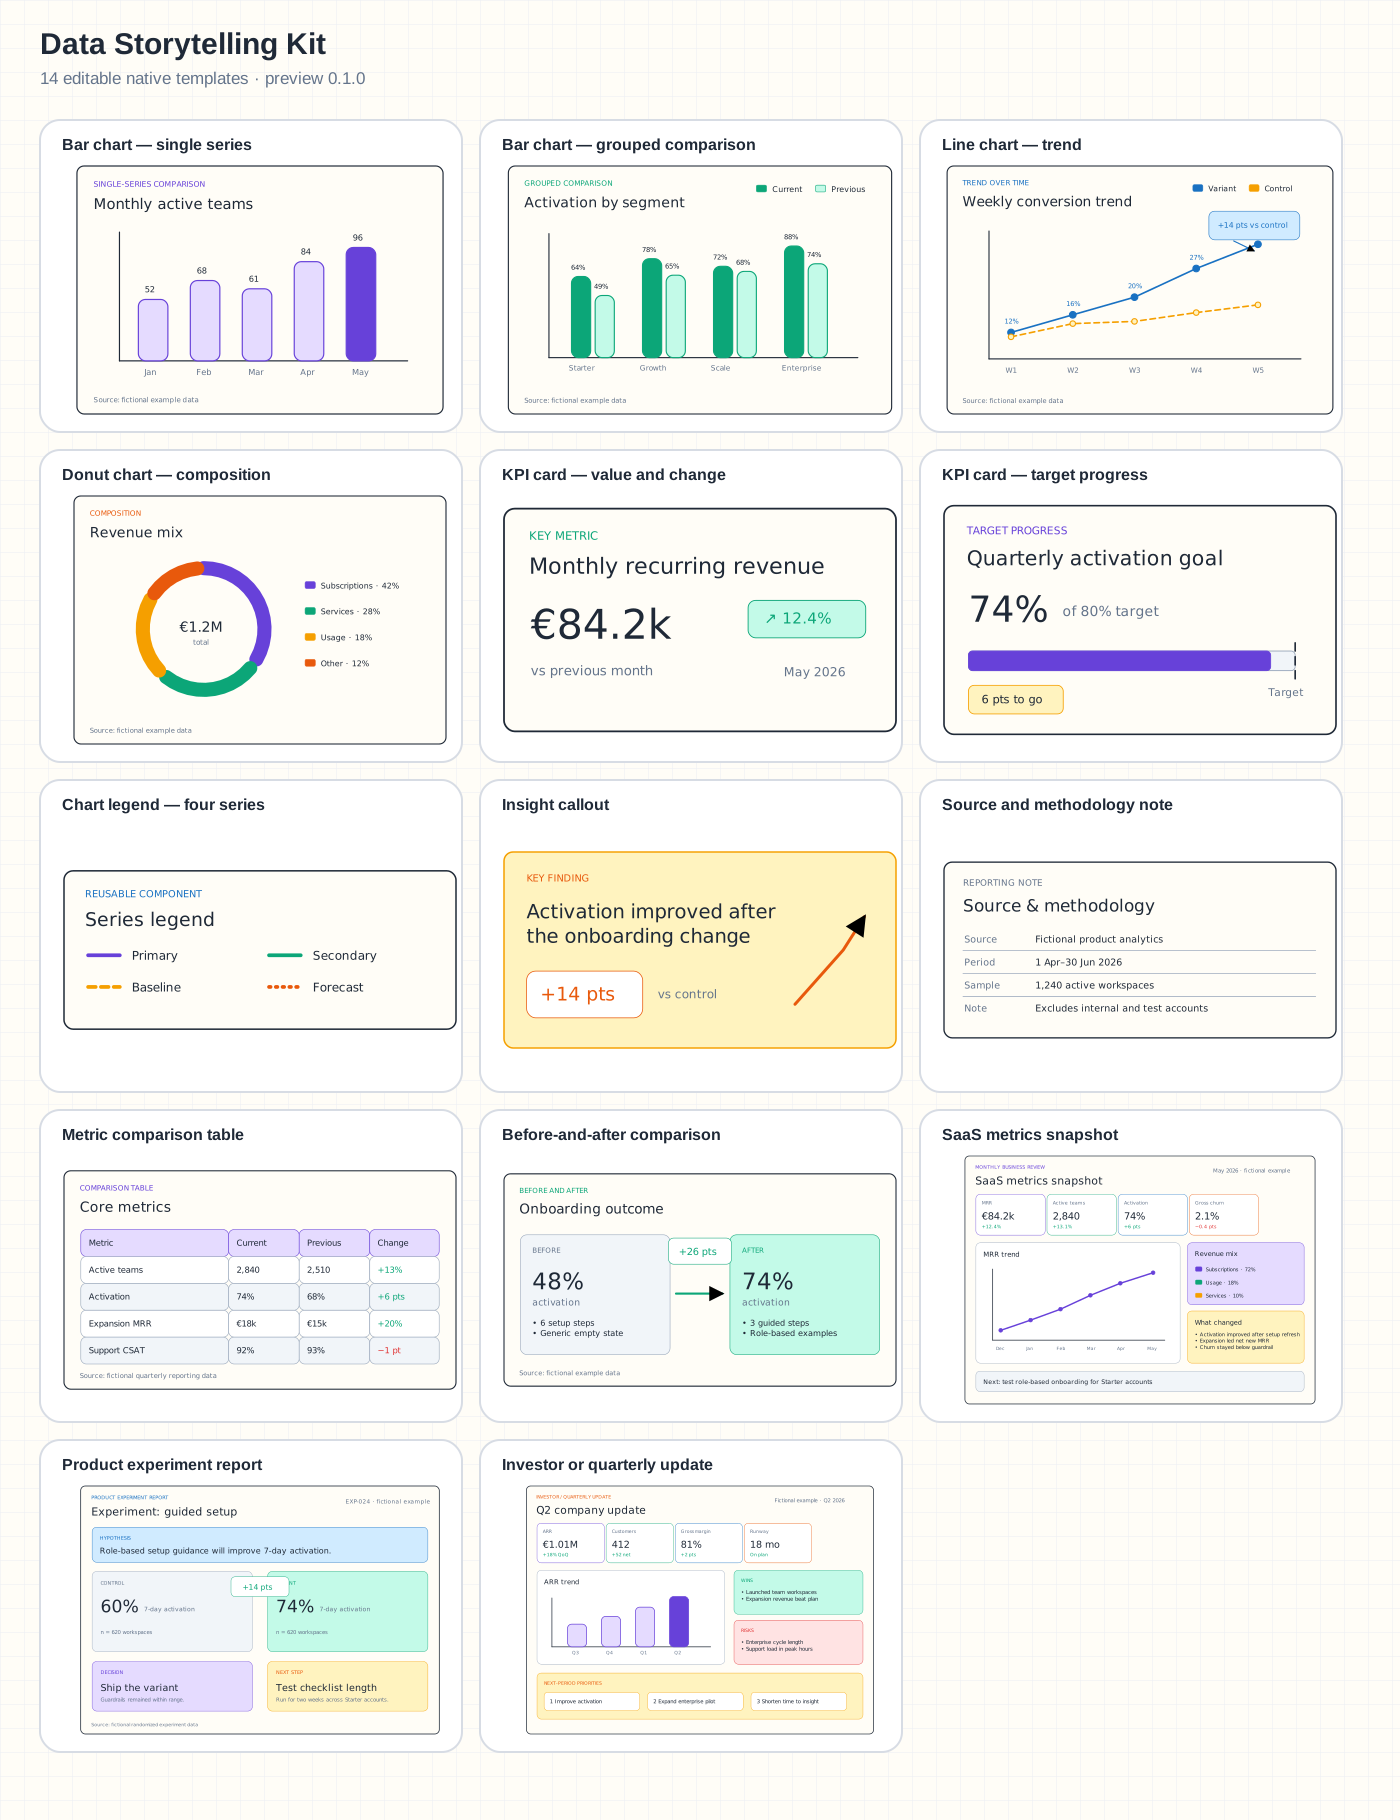
The Data Storytelling Kit by DrawCharts gives you 14 hand-drawn chart, metric, table, and report templates made from native elements compatible with Excalidraw.

Use the templates for manual composition. Use DrawCharts when the visual needs to be generated from actual data.

Library preview

14 pieces for a complete data story

Contact sheet showing the editable chart, KPI, table, and report templates in the Data Storytelling Kit
14
independent items
341
native elements
100%
editable
0
trackers in the file

What’s inside

From one chart to a whole reporting narrative.

Each asset works on its own. Together they cover the usual rhythm of a data story: signal, evidence, explanation, and next step.

Explore chart-making workflows
01

Chart templates

Start with an editable chart, then replace every label, value, and color directly on the canvas.

  • Bar chart — single series
  • Bar chart — grouped comparison
  • Line chart — trend
  • Donut chart — composition
02

Reusable components

Add the reporting details that make a chart understandable without rebuilding common patterns.

  • KPI card — value and change
  • KPI card — target progress
  • Chart legend — four series
  • Insight callout
  • Source and methodology note
03

Structured comparison

Explain changes with compact tables and before-and-after layouts made from native elements.

  • Metric comparison table
  • Before-and-after comparison
04

Complete data stories

Drop in a coherent report structure for product reviews, experiments, or quarterly updates.

  • SaaS metrics snapshot
  • Product experiment report
  • Investor or quarterly update

Three-minute setup

Load it, place it, make it yours.

1

Download the library

Save the .excalidrawlib file from this page.

2

Load it in Excalidraw

Open the Library panel, choose Load library, and select the file.

3

Ungroup and edit

Insert an item, ungroup it, then replace labels, values, colors, and notes.

When templates are not enough

Turn your actual data into a hand-drawn chart.

Use DrawCharts for data-driven generation, then bring the result into the visual workflow where you tell the broader story.

Create from data →

Questions

Good to know before you load it.

Does this library generate charts from data?

No. The library contains manually editable templates. Use DrawCharts when you want to turn CSV or structured data into a finished hand-drawn chart.

Can I edit every item after inserting it?

Yes. The kit uses native shapes, text, lines, arrows, and groups—no raster images, web embeds, or external assets.

Is this an official Excalidraw product or partnership?

No. This is an independent DrawCharts library compatible with Excalidraw. Excalidraw is a trademark of its respective owner.

What is included in this preview?

Version 0.1 includes all 14 planned templates plus the editable source scene. It is being prepared for marketplace review.

Independent library by DrawCharts, made for use with Excalidraw. No official partnership or endorsement is implied.