Image Editor
Combine imagery and hand-drawn charts to publish clearer visual stories.
No signup required • Free forever
Turn Static Images into Data Stories
The image editor helps teams publish chart-driven visuals where context matters. Instead of showing raw numbers in isolation, you can place data directly where the audience is already looking.
Typical Use Cases
- Social campaigns: Add trend snippets to shareable image formats.
- Product updates: Overlay usage metrics on UI screenshots.
- Learning content: Annotate diagrams and teaching visuals with data callouts.
Workflow for Better Outputs
- Start with one base image and one core metric.
- Place chart overlays near relevant visual context.
- Keep labels short and avoid overlapping busy image areas.
- Export and review at target publish size before posting.
Need raw chart generation first? Start with bar charts or line charts and then compose final visuals here.
Image Editor Example
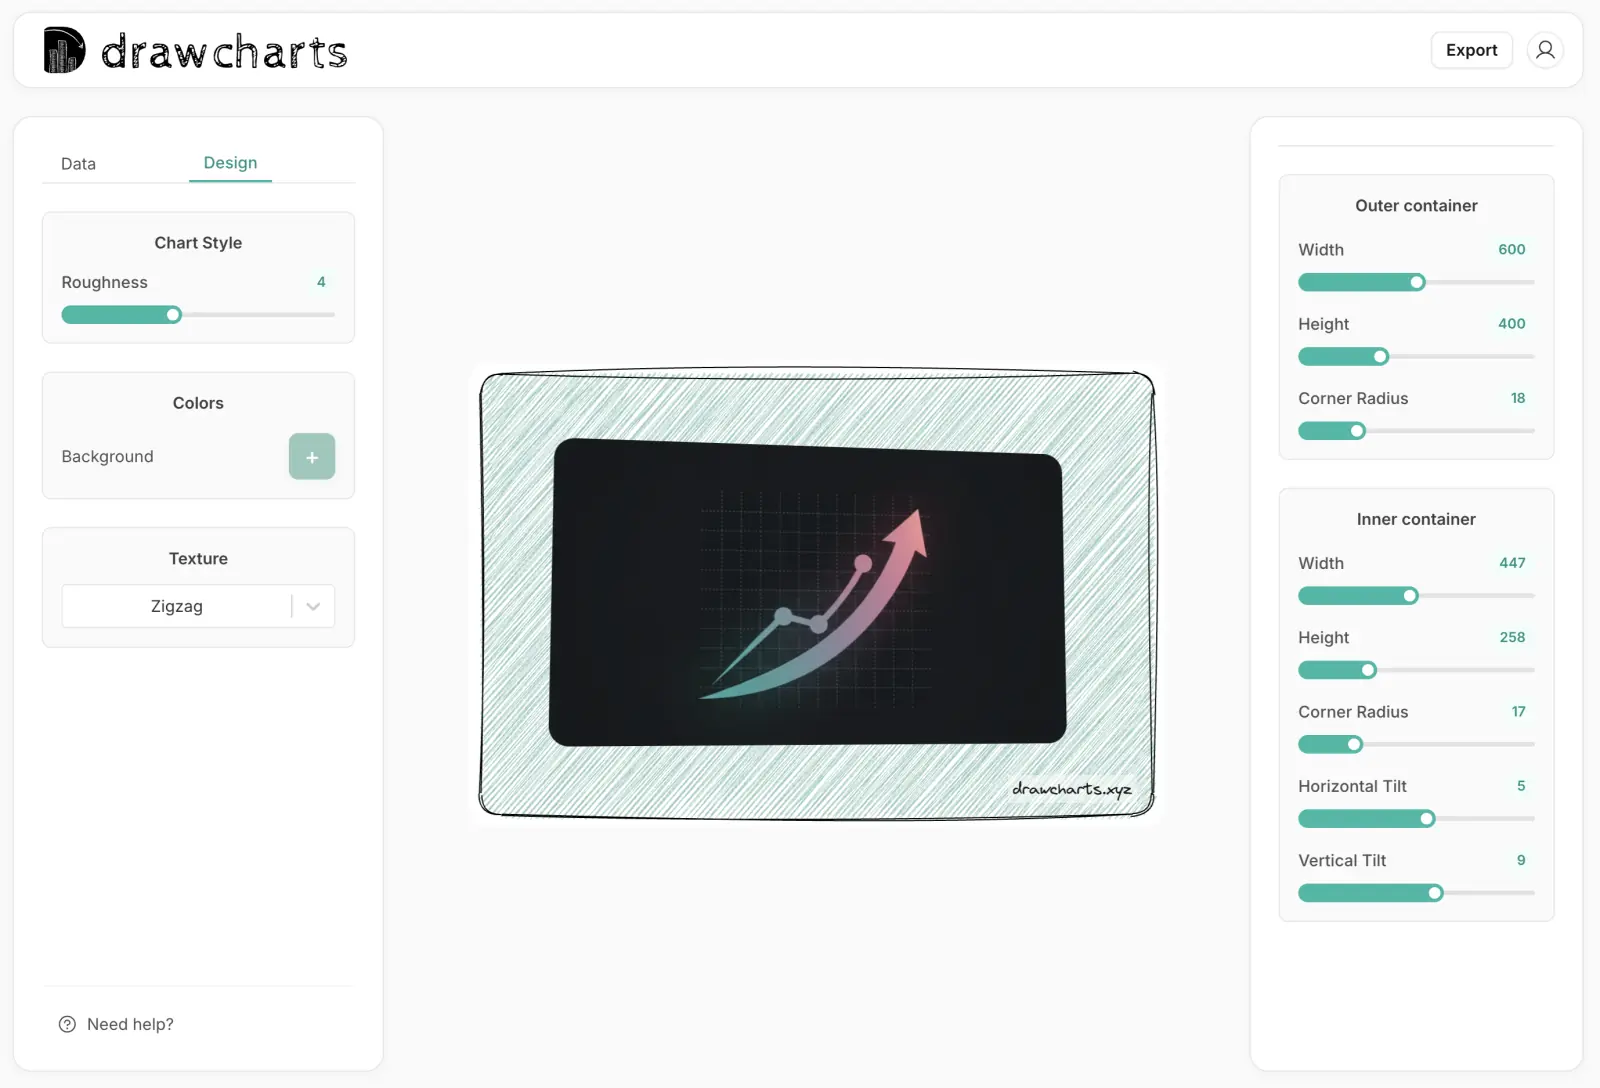
Image Editor FAQs
Use overlays intentionally so image context and chart signal support the same story.
Use it to place chart visuals on screenshots, social graphics, product mockups, and educational assets.
Yes. You can combine chart and annotation layers to create a single narrative visual for campaigns or reports.
Use contrast blocks, short labels, and clear placement away from high-detail image regions.
PNG is a strong default for quality and compatibility. Use JPEG when file size is critical.
Need help with a specific use case?
Share your chart goal and we can suggest the fastest setup.