1. Define one message
Start each page and chart with one primary question. Avoid combining multiple goals on one page. Focused intent improves both user comprehension and search relevance.
Choose the right chart workflow for your message, then generate a sketch-style visual in minutes.
No signup required • Free forever
Looking for the fastest way to draw chart online or draw charts online? Start with one question, pick the matching chart type, and export once the takeaway is clear. This page is the main entry point for those workflows.
If you want a step-by-step walkthrough first, read How to Draw a Chart Online or Chart Drawing Examples for Presentations.
Most indexing and engagement issues come from generic pages. This hub keeps each path focused on one intent so users and search engines can understand exactly what each page offers.
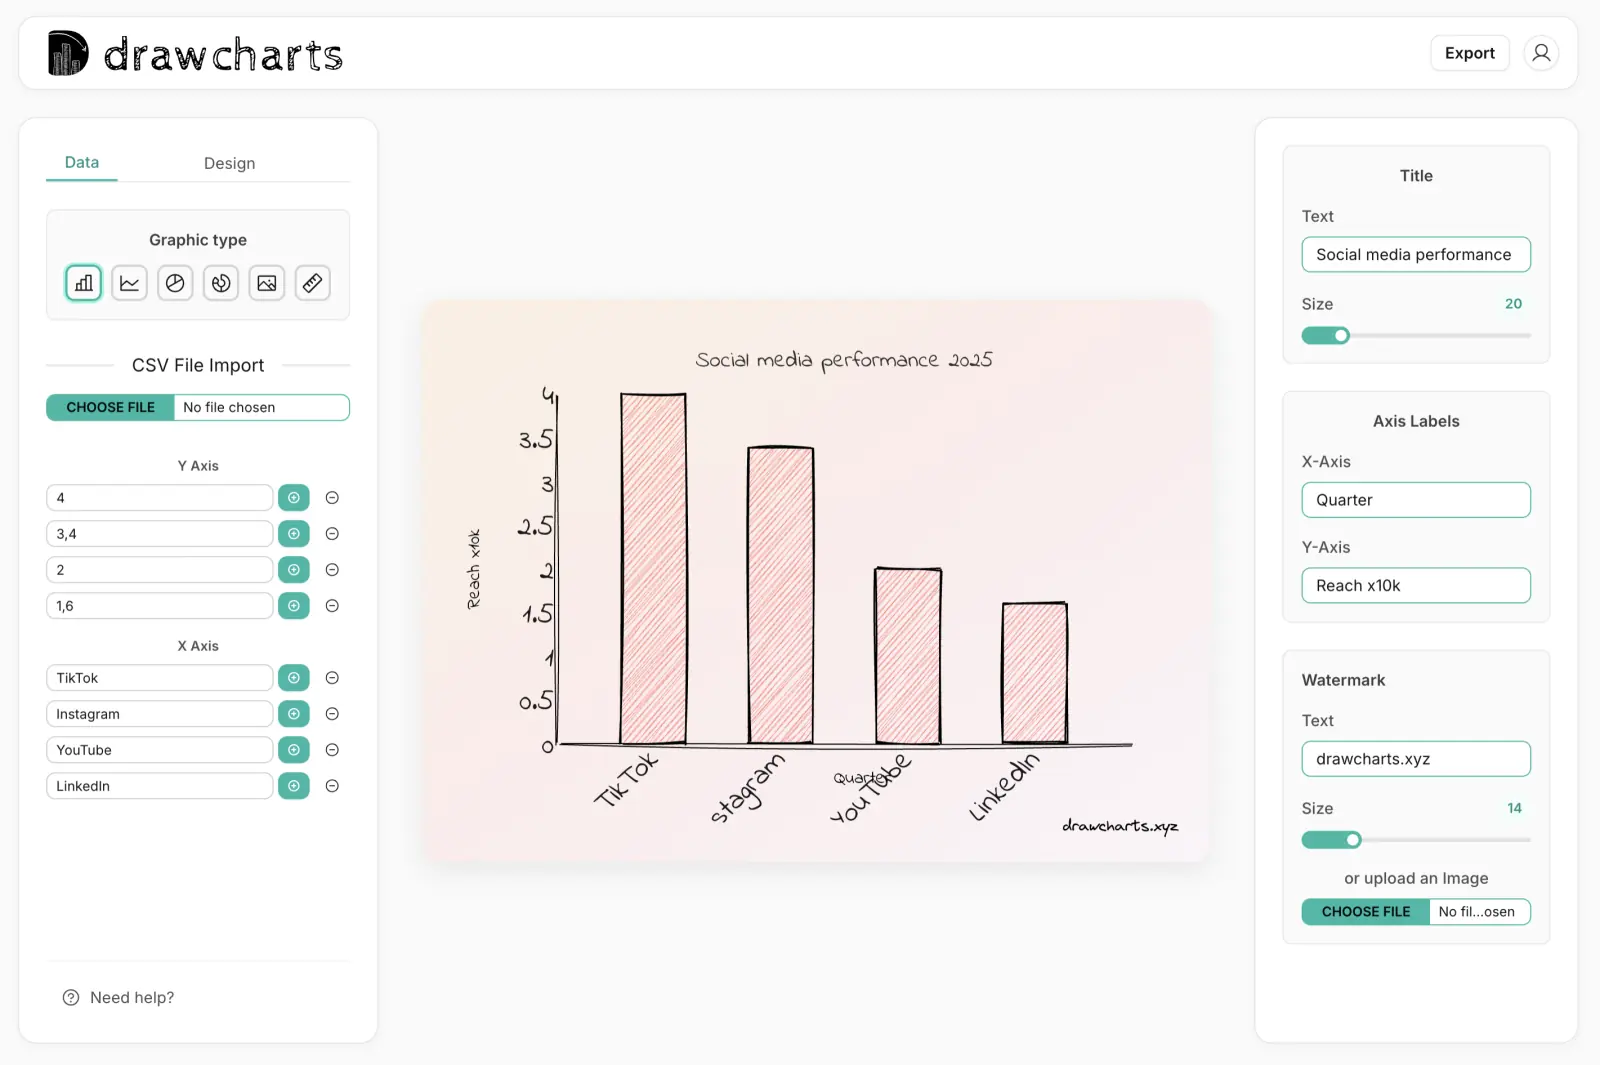
Compare categories, highlight winners, and present clear side-by-side performance.
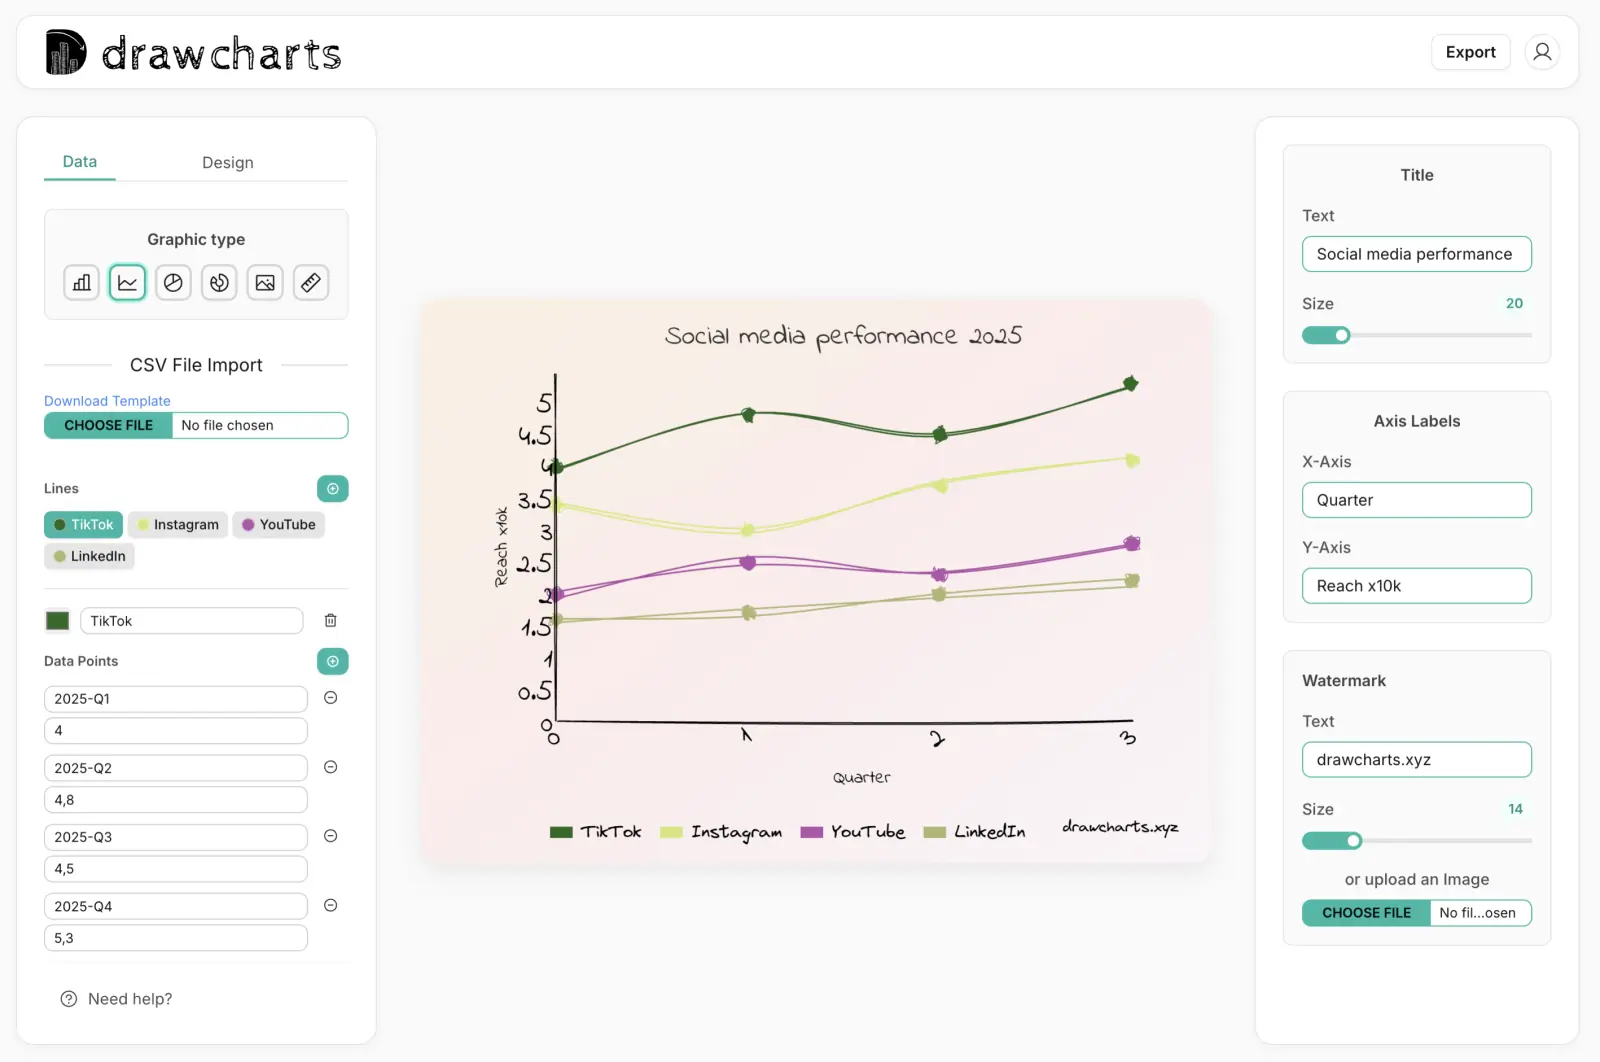
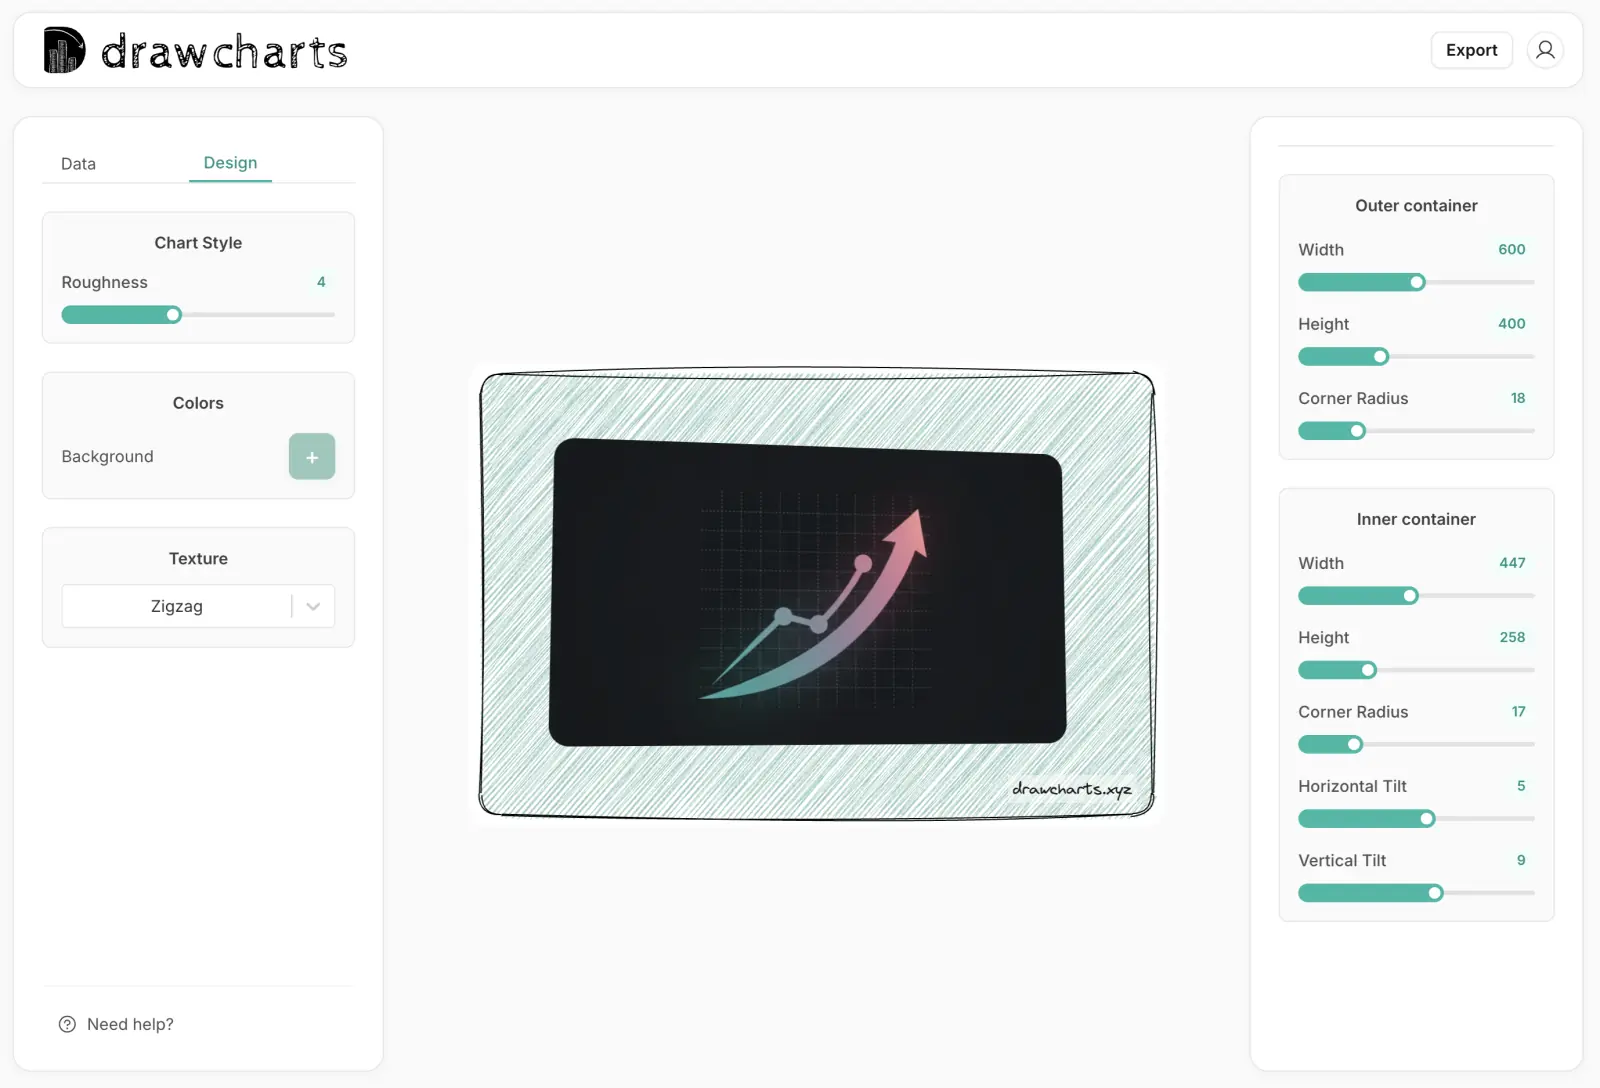
Show movement over time, detect inflection points, and communicate trend direction quickly.
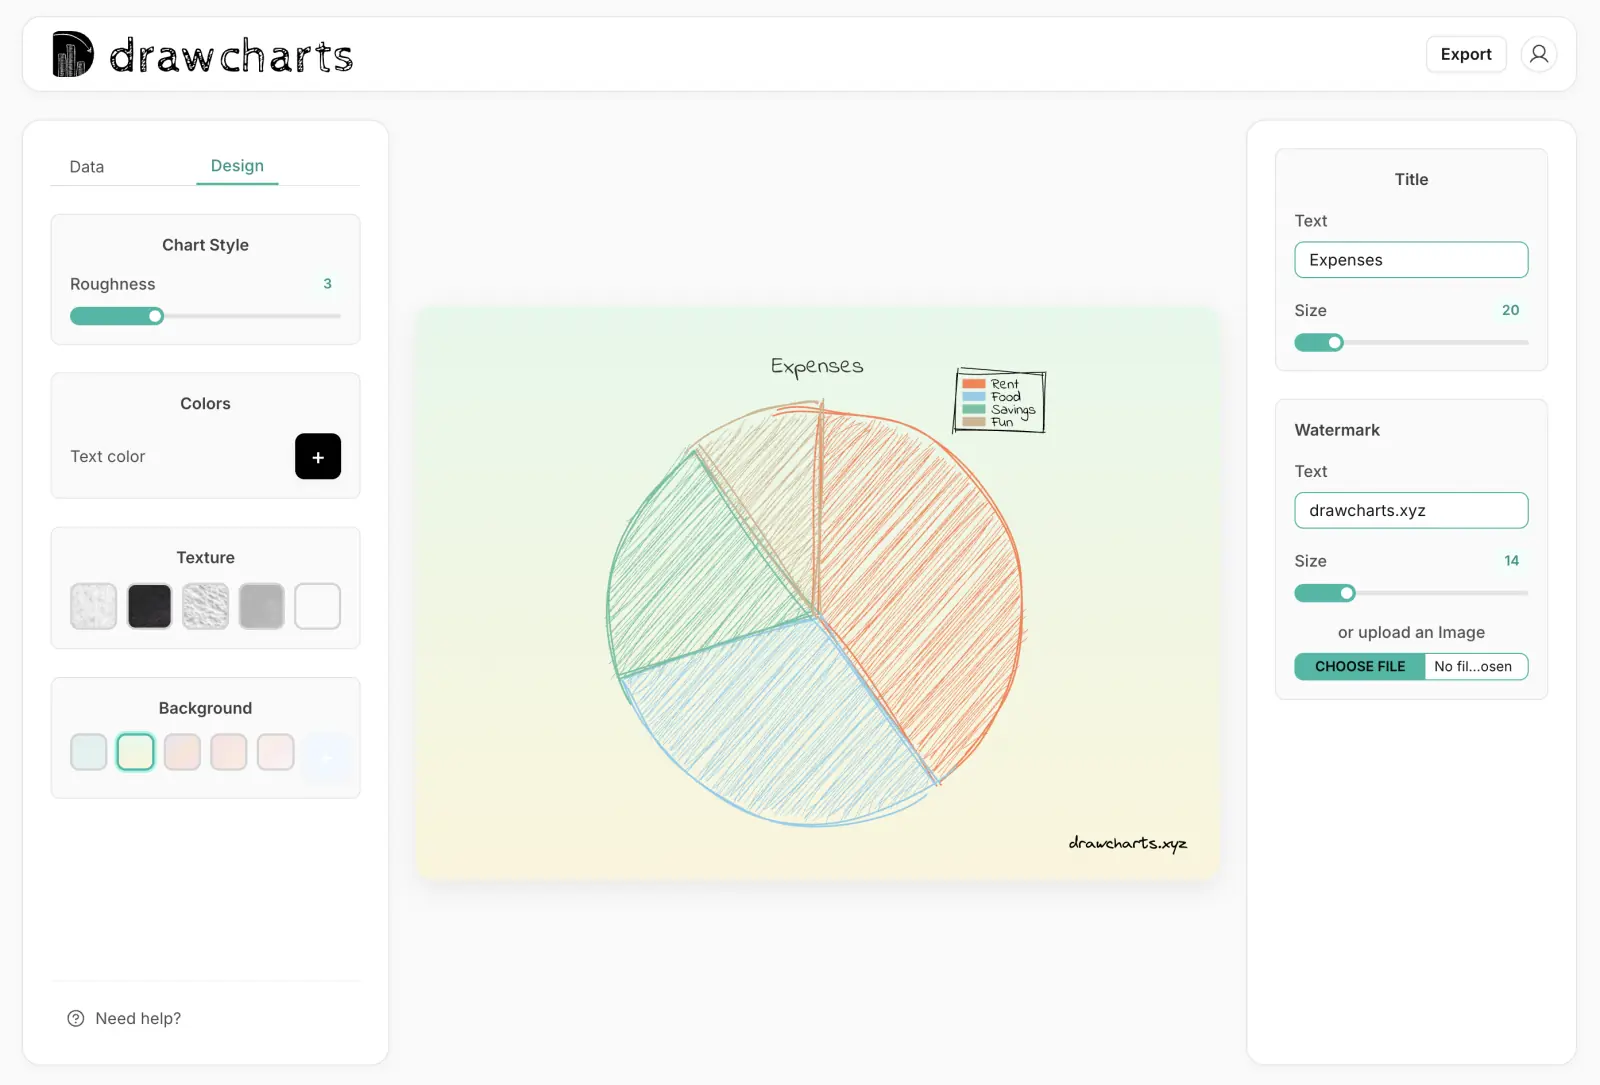
Explain part-to-whole splits for budget, allocation, and composition storytelling.
Show overlap and unique segments across two or three sets in one visual.
Map flows, systems, and decisions with a whiteboard-style visual language.
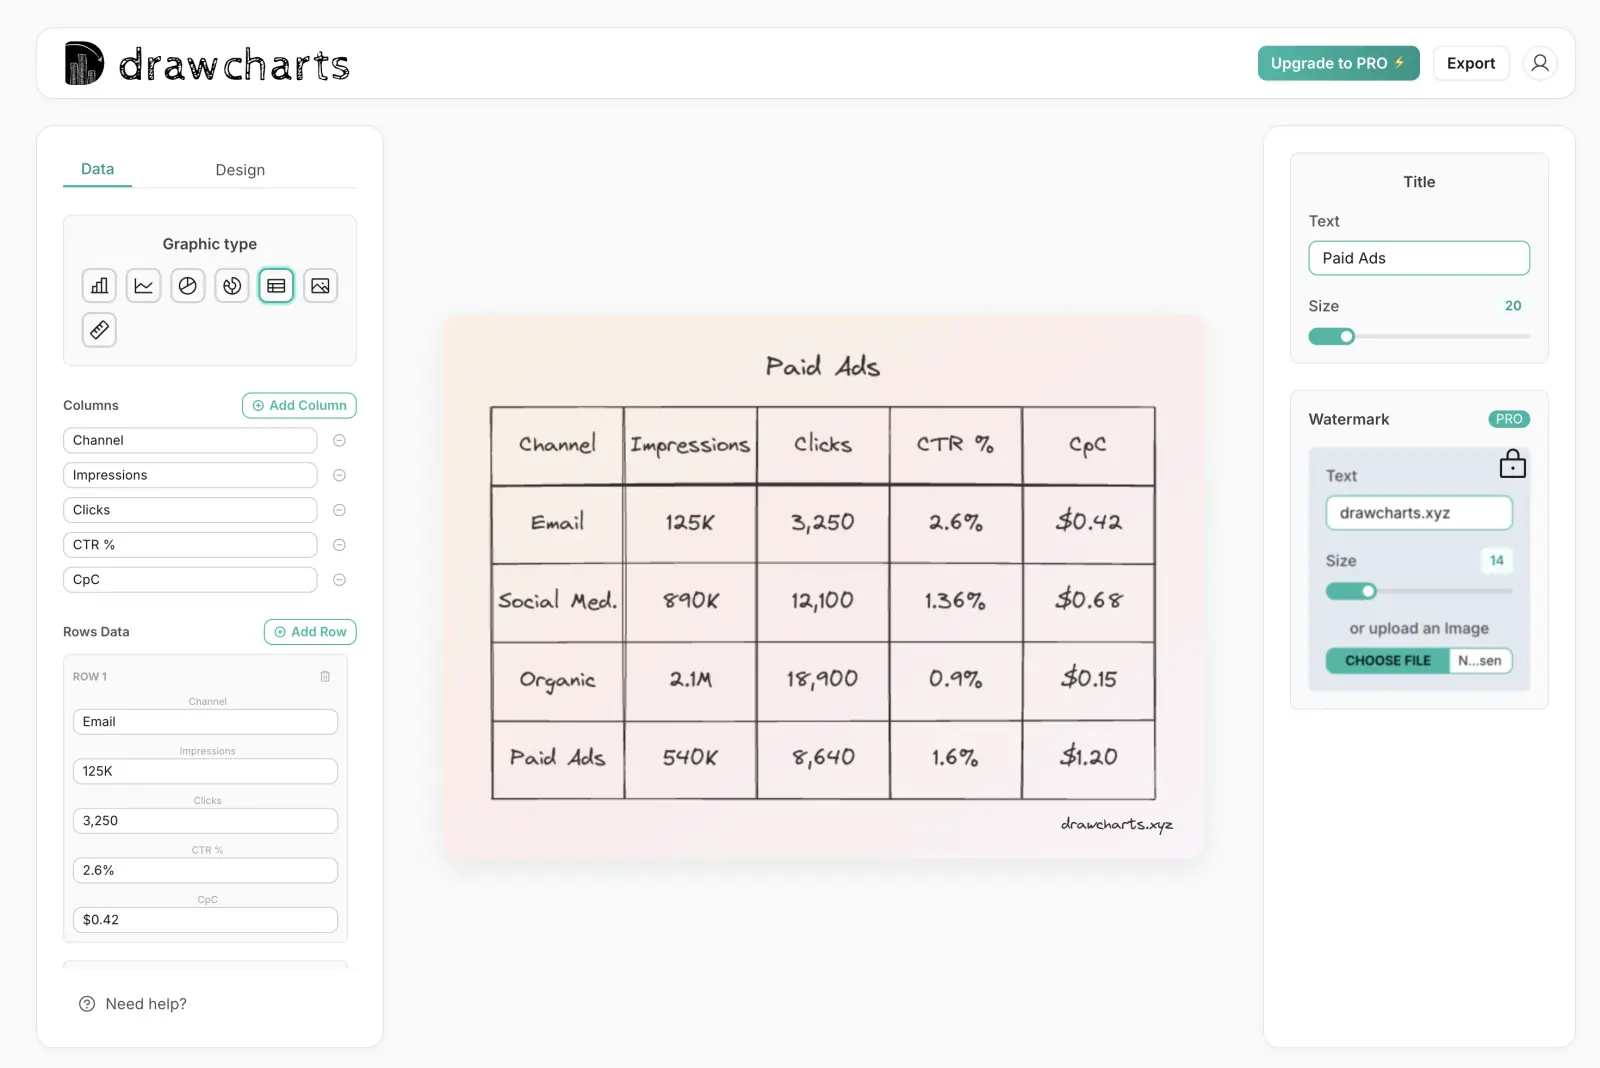
Turn dense rows into readable hand-drawn tables for planning and reporting.
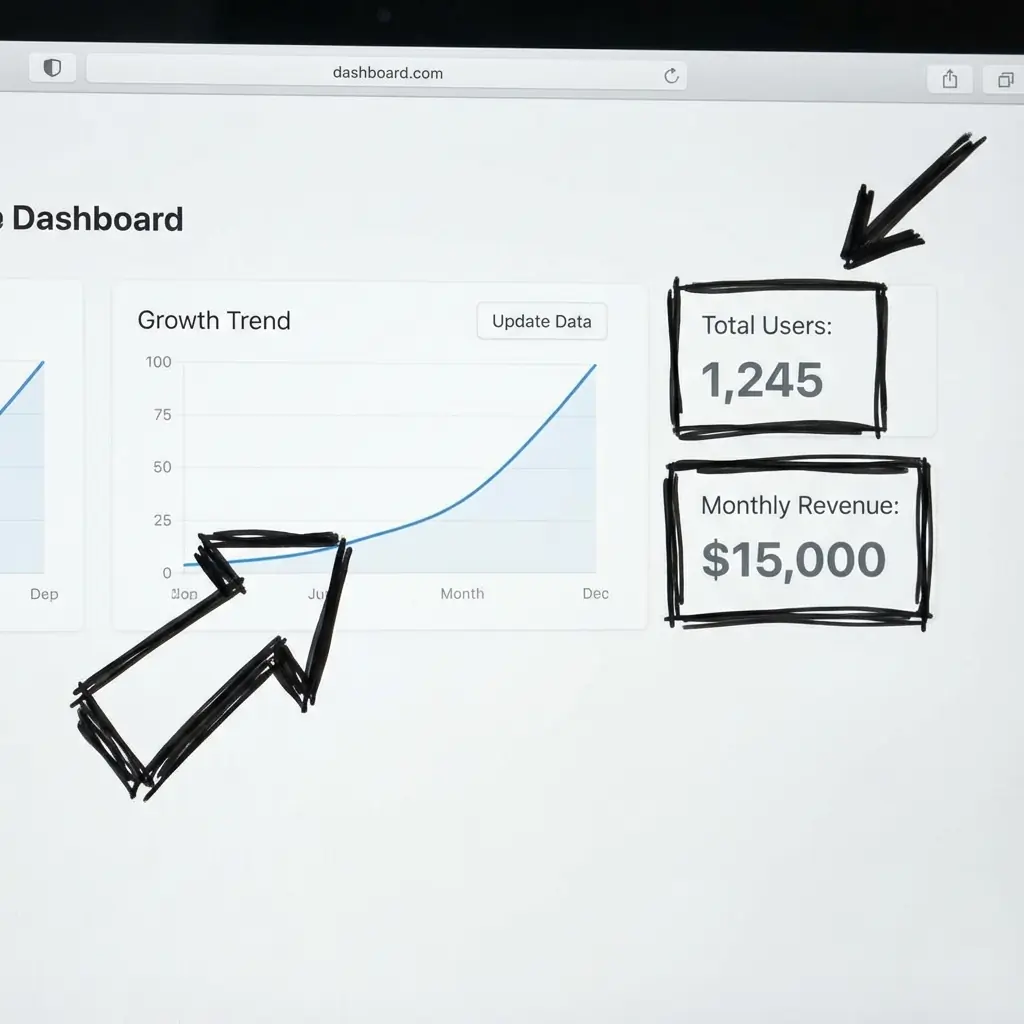
Overlay chart elements on screenshots, photos, and campaign visuals.
Start each page and chart with one primary question. Avoid combining multiple goals on one page. Focused intent improves both user comprehension and search relevance.
Pick the tool based on data structure, not preference. Category comparisons, trends, proportions, and process maps each need a different visual grammar.
Write unique page copy that reflects actual use cases, constraints, and mistakes for that chart type. Generic blocks across many pages reduce indexing confidence.
Add clear internal paths to complementary tools and guides. We recommend following this hub with the DrawCharts blog for implementation examples.
Use this hub to choose the right chart workflow and reduce trial-and-error in your reporting process.
Use one question per chart. Pick bar charts for comparisons, line charts for trends, pie charts for proportions, venn diagrams for overlaps, and diagrams for process explanations.
Start here if you are still deciding. If you already know your chart type, jump directly to the corresponding maker page for faster output.
Yes. Build the core chart first, then add annotations, callouts, or overlays in the diagram maker or image editor.
Both. This hub is designed to help search visitors find the right workflow and then continue into the app with minimal friction.
Use one style profile per deck: consistent color palette, stroke style, labeling pattern, and title format across all exported charts.
Share your chart goal and we can suggest the fastest setup.
Experience the power of beautiful hand-drawn charts that captivate and engage. No credit card required.
Start For Free
What People Are Saying
Real feedback from our users on Twitter
Loved by creators worldwide
See what our users are saying about their experience with drawcharts